Cycle Plot
The Data by Cycle plot displays plots that allow you to follow the progression of quality metrics during a run. These plots have the following features:
|
•
|
You can select the displayed metric, lane, surface, and base through the dropdown lists. |
|
•
|
The plots are displayed with tailored scaling by default, or can be fixed by checking the Fix Scale checkbox. |
|
•
|
The chevron in the top right hand corner toggles the plot between pane view and full screen view. |
|
•
|
You can pan the graph by clicking-and-dragging, zoom in by using the mousewheel, and zooming in only on a particular axis by using the mouse wheel over that axis. |
|
•
|
By right-clicking an image you can copy it to the clipboard. |
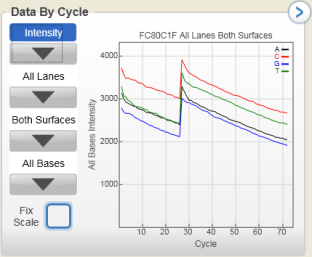
Figure 3 Data by Cycle Plot
You can monitor the following quality metrics with this plot:
|
•
|
Intensity—This plot displays the intensity by color of the 90% percentile of the data for each cycle. |
|
•
|
Corrected Intensity—The intensity corrected for cross-talk between the bases and phasing and prephasing. |
|
•
|
Called Intensity—The intensity for the called base. |
|
•
|
% Base—The percentage of clusters for which the selected base has been called. |
|
•
|
Signal to Noise—The signal to noise ratio is calculated as mean called intensity divided by standard deviation of non called intensities. |
|
•
|
Error Rate—The calculated error rate, as determined by a spiked in PhiX control sample. If no PhiX control sample is run in the lane, this chart is not available. |
|
•
|
% Perfect Reads—The percentage of reads that align perfectly, as determined by a spiked in PhiX control sample. If no PhiX control sample is run in the lane, this chart is not available. |
|
•
|
%Q>20, %Q>30—The percentage of bases with a quality score of 20 or 30 or higher, respectively. These charts are generated after the 25th cycle, and the values represent the current cycle. A check box appears that lets you toggle between cumulative (include previous cycles) or not (just display current cycle). |
|
•
|
Median Q-Score—The median Q-Score over all basesfor the current cycle. These charts are generated after the 25th cycle. |
|