Imaging Tab
The Imaging tab lists detailed data and metrics for the run.
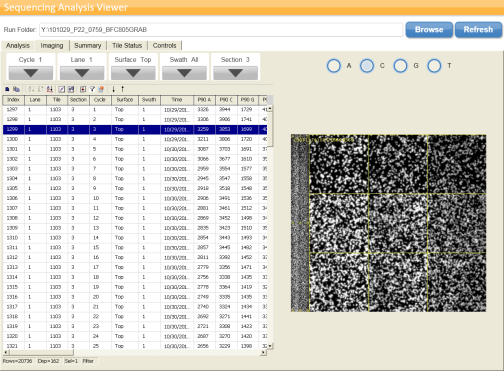
You can select the displayed cycle, lane, surface, swath, and section through the dropdown lists, while the checkboxes can be used to select the displayed bases. In addition, the imaging tab displays available thumbnails for the selected tile, highlighted in blue in the table. You can also use a mouse wheel or the arrow keys on a keyboard to scroll through images. Right-clicking on the top of a column provides more info.
Figure 5 Imaging Tab
You can track the following metrics:
|
•
|
P90 —This displays the intensity by color of the 90% percentile of the data for each cycle. —This displays the intensity by color of the 90% percentile of the data for each cycle.
|
|
•
|
Error Rate—The calculated error rate, as determined by the PhiX alignment.
|
|
•
|
% Base—The percentage of clusters for which the selected base has been called. Includes the percentage non-called (%NC).
|
|
•
|
Density—The density of clusters detected by image analysis (in thousands per mm2) |
|
•
|
Density PF—The density of clusters passing filter (in thousands per mm2)
|
|
•
|
% Aligned—The percentage of the sample that aligned to the PhiX genome, read 1 and read 2
|
|
•
|
% Phasing/Prephasing—The value used by RTA for the percentage of molecules in a cluster for which sequencing falls behind (phasing) or jumps ahead (prephasing) the current cycle within a read, read 1 and read 2.
|
|
•
|
Corrected Base—The intensity corrected for cross-talk between the bases and phasing and prephasing.
|
|
•
|
Signal to noise—The signal to noise ratio is calculated as mean called intensity divided by standard deviation of non called intensities.
|
|
•
|
%Q>=30—The percentage of bases with a quality score of 30 or higher, respectively. This chart is generated after the 25th cycle, and the values represent the current cycle. |
|
•
|
%PF—The percentage of clusters passing filter
|
The buttons above the data table allow you to do the following:
|
•
|
 —Select all rows. —Select all rows.
|
|
•
|
 —Copy selected rows to clipboard. —Copy selected rows to clipboard.
|
|
•
|
 —Sort columns in ascending, descending, or custom fashion. —Sort columns in ascending, descending, or custom fashion.
|
|
•
|
 —Create custom scatter or box plot. —Create custom scatter or box plot.
|
|
•
|
 —Choose columns to display. —Choose columns to display.
|
|
•
|
 —Filter columns, or clear filter. —Filter columns, or clear filter.
|
|
•
|
 —Move thumbnail selection up or down. —Move thumbnail selection up or down.
|
|