QScore Distribution
The QScore Distribution pane displays plots that allow you to view the number of reads by quality score. The quality score is cumulative for current cycle and previous cycles, and only reads that pass the quality filter are included.
These plots have the following features:
| • | You can select the displayed lane, surface, read, and cycle through the dropdown lists. |
| • | The Read drop-down list is used to select the first cycle for calculating the histogram. |
| • | The Cycle drop-down list is used to determine the last cycle used for calculating the histogram . The last cycle for calculating the histogram is the minimum of the cycle selected in the Cycle drop-down box and the last cycle of read selected in Read drop-down list. |
| • | The cutoff slider allows you to determine how many bases have a minimum QScore or higher. Grab the slider with your mouse pointer, and drop it at the minimum QScore. The BaseSpace then calculates how many bases have that QScore or higher. |
| • | The chevron in the top right hand corner toggles the plot between pane view and full screen view. |
| • | You can pan the graph by clicking-and-dragging, zoom in by using the mousewheel, and zooming in only on a particular axis by using the mouse wheel over that axis. |
| • | By right-clicking an image you can copy it to the clipboard. |
Figure 6 QScore Distribution Plot
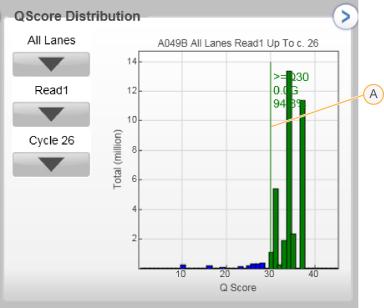
| A | Cutoff Slider |
Note that the QScore is based on the Phred scale. The following table list Qscores and the corresponding chance that the base call is wrong:
|
QScore |
Chance of Wrong Base Call |
|---|---|
|
Q10 |
10 % |
|
Q20 |
1 % |
|
Q30 |
0.1 % |
|
Q40 |
0.01 % |