Circos Plot of Somatic Variations
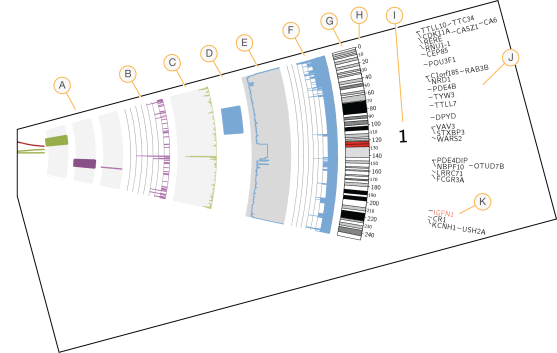
The Circos plot provides visualization of somatic small variation, ploidy, and structural variations reported in the somatic variation files (VCF). The Circos plot displays somatic variation data in tracks with chromosomes circularly arranged. Following is an example legend. Labels are described from inside the circle to the outside.
|
Legend |
Label (From Inner Circle to Outer Circle) |
Description |
|||||||||||||||
|---|---|---|---|---|---|---|---|---|---|---|---|---|---|---|---|---|---|
|
|
Somatic structural variants |
The somatic structural variants detailed in somatic.SVs.vcf are plotted in the center of the plot.
|
|||||||||||||||
|
B |
Number of somatic indels per Mb |
The density of PASS somatic indels reported in somatic.indels.vcf.gz in 1Mb windows. The scale of y-axis in the histogram indicates the counts. |
|||||||||||||||
|
C |
Number of somatic SNVs per Mb |
The density of PASS somatic SNVs reported in somatic.snvs.vcf in 1Mb windows, arbitrarily scaled in a histogram with y-axis pointing inward. | |||||||||||||||
|
D |
Copy-neutral loss of heterozygosity (LOH) |
The LOH regions with SNP calls in the normal genome but a homozygous reference call in the tumor genome, in CNVs.vcf. | |||||||||||||||
|
E |
B-allele frequency |
The B-allele ratios calculated by SENECA that will be used in the ploidy and purity estimation. | |||||||||||||||
|
F |
Called level |
The copy number aberrations from CNVs.vcf file. The scale of y-axis in the histogram indicates the called level. |
|||||||||||||||
|
G |
Karyotype |
The standard Circos ideogram defining the chromosome position, identity, and color of cytogenetic bands. | |||||||||||||||
|
H |
Chromosome position |
The reference coordinates along the chromosome (in megabases) | |||||||||||||||
|
I |
Chromosome number |
Chromosome number: 1, 2,…,22, X, Y. | |||||||||||||||
|
J |
HGNC symbols for genes harboring variants |
HGNC genes impacted by somatic SNVs. Genes containing SNVs in the coding region with an HGNC symbol are labeled. |
|||||||||||||||
|
K |
Genes of non-synonymous variants |
Genes identified in (J) resulting in non-synonymous changes in the coding region are highlighted in red. |