Tumor Sample Page
The Tumor Normal app provides an overview of statistics on the tumor sample page. A brief description of the metrics is below.
You can also download the report for the tumor and normal samples as PDF files (SampleName_S1.pdf).
Alignment Summary
| Statistic | Definition |
|---|---|
| Number of reads | Total number of reads passing filter for this sample. |
|
Coverage |
Total number of aligned bases divided by the genome size. |
|
Percent Duplicate Paired Reads |
Percentage of paired reads that have duplicates. |
|
Fragment Length Median |
Median length of the sequenced fragment. The fragment length is calculated based on the locations at which a read pair aligns to the reference. The read mapping information is parsed from the BAM files. |
|
Fragment Length Standard Deviation |
Standard deviation of the sequenced fragment length. |
| • | Read Statistics |
| Statistic | Definition |
|---|---|
|
Percent Aligned |
Percentage of reads passing filter that aligns to the reference. |
| Percent Q30 | The percentage of bases with a quality score of 30 or higher. |
|
Mismatch Rate |
Percentage of aligned bases that do not match the reference. These mismatches include mismatches due to variants, or errors stemming from artifacts of library preparation, sequencing, or alignment. |
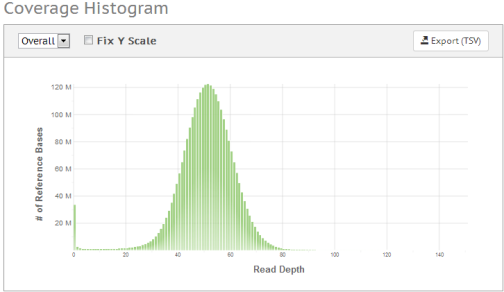
Coverage Histogram
The coverage histogram shows the number of reference bases plotted against the depth of coverage (read depth). It has the following features:
| • | The dropdown menu allows you to look at the overall picture, or highlight a particular chromosome. |
| • | The Fix Y Scale checkbox allows you to keep the Y Scale the same when comparing multiple chromosomes. |
| • | The Export TSV link allows you to export the coverage data in a tab-separated TXT file. |
Figure 5 Tumor Normal Coverage Histogram