Data by Lane
The Data by Lane plots allow you to view quality metrics per lane.
Use the Data By Lane plot to examine the difference in quality metrics between lanes. Do not use the Data By Lane plot to look at alignment or variant calling analysis metrics.
The Data by Lane plot has the following features:
|
•
|
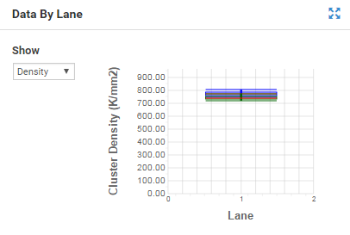
You can select the metric, surface, and read from the drop-down lists. |
|
•
|
The plots show the distribution of mean values for a given parameter across all tiles in a given lane.
|
|
•
|
The red line indicates the median tile value for the parameter displayed. |
|
•
|
Blue boxes are for raw clusters, green boxes for clusters passing filter. |
|
•
|
The box outlines the interquartile range (the middle 50% of the data) for the tiles analyzed for the data point. |
|
•
|
The error bars delineate the minimum and maximum without outliers. |
|
•
|
The outliers are the values that are more than 1.5 times the interquartile range below the 25th percentile, or more than 1.5 times the interquartile range above the 75th percentile. Outliers are indicated as dots. |
|
•
|
You can focus on an area of interest by dragging to pan the view or using the mouse wheel to zoom in. |
The following table details the possible metrics displayed in this plot. The available options vary by run.
Data By Lane Plot Options
|
Density
|
The density of clusters for each tile (in thousands per mm2).
|
|
Clusters
|
The number of clusters for each tile (in millions).
|
|
Phasing, Prephasing
|
The estimated percentage of molecules in a cluster for which sequencing falls behind (phasing) or jumps ahead (prephasing) the current cycle within a read.
|
|
Legacy Phasing Rate, Legacy Prephasing Rate
|
The estimated percentage of molecules in a cluster for which sequencing falls behind (phasing) or jumps ahead (prephasing) the current cycle within a read.
Legacy rates consider only the first 25 cycles.
|
|
% Aligned
|
The percentage of reads from clusters in each tile that aligned to the PhiX genome.
|
|
Occupied Count (K)
|
The total number of wells (in thousands) on the flow cell containing clusters with DNA usable for sequencing. Wells with at least nine G bases called in the first 10 cycles are considered empty. Low occupancy rate combined with low %PF may indicate the loading concentration is too low. High occupancy rate combined with suboptimal %PF may indicate the loading concentration is too high.
|
|
% Percent Occupied
|
The percentage of wells (for patterned flow cells) or nonduplicated spots (for nonpatterned flow cells) on the flow cell containing clusters. Wells with at least nine G bases called in the first 10 cycles are considered empty.
|
|
% PF
|
The percentage of clusters passing filter that are assigned to the index.
|