Q-Score Heatmap
The Q-Score Heatmap provides an overview of quality scores across cycles.
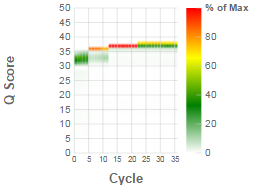
The Q-Score Heatmap has the following features:
|
•
|
The vertical color bar indicates the value that each color represents. |
|
•
|
Scaling is specific to the run, representing 0%–100% of the maximum value. |