Q-Score Distribution
Q-Score Distribution graphs the number of bases by quality score. The quality score is cumulative for the current cycle. Only bases from reads that pass the quality filter are included.
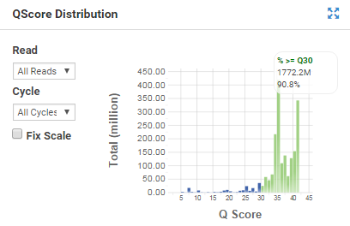
Use it to evaluate the Q-Score distribution for a run, which is an excellent indicator for run performance.
The Q-Score Distribution chart has the following features:
| • | You can select the displayed read and cycle using the drop-down lists. |
| • | The chart is displayed with tailored scaling by default, or you can fix the Y-axis scale by selecting the Fix Scale checkbox. |
| • | Some metrics (% ≥Q20 and % ≥Q30) are monitored for a single cycle by default, or you can monitor the cumulative metrics (up to that cycle) by selecting the Accum checkbox. |
| • | You can focus on an area of interest by dragging to pan the view or using the mouse wheel to zoom in. |